
Each year, from June-October, polar climate scientists from the Met Office produce a series of monthly sea ice briefings for the government and the general public. These briefings describe the state of Arctic and Antarctic sea ice, compare how these relate to historic patterns, and, where possible, assess causes of unusual behaviour.
Sea ice is frozen seawater that floats on the surface of the ocean and is found when temperatures are cold enough for sea water to freeze. The extent of sea ice is a key climate indicator, because sea ice cover insulates the ocean in winter and reflects sunlight in summer, as well as providing a habitat for a range of species.

Here, Senior Scientist Alex West talks about the 2023 Antarctic sea ice minimum and its interaction with the ocean and atmosphere.
Lowest sea ice extent on record
Antarctic average sea ice extent for 2023 was the lowest on record. During the ice growth season from June-October, ice extent was exceptionally low for the time of year, reaching over 1 million square km below previous record lows and setting a new record low maximum extent by a very large margin. For much of the rest of the year, the ice was at record or near-record low levels, recording a second successive record low minimum in February (Figure 1).

Figure 1. Antarctic sea ice extent in 2023 (bold black line) with other recent years indicated, as well as earlier years with notably low sea ice extent. The 1981-2010 average is also shown, with the shaded region indicating 2 standard deviation intervals.
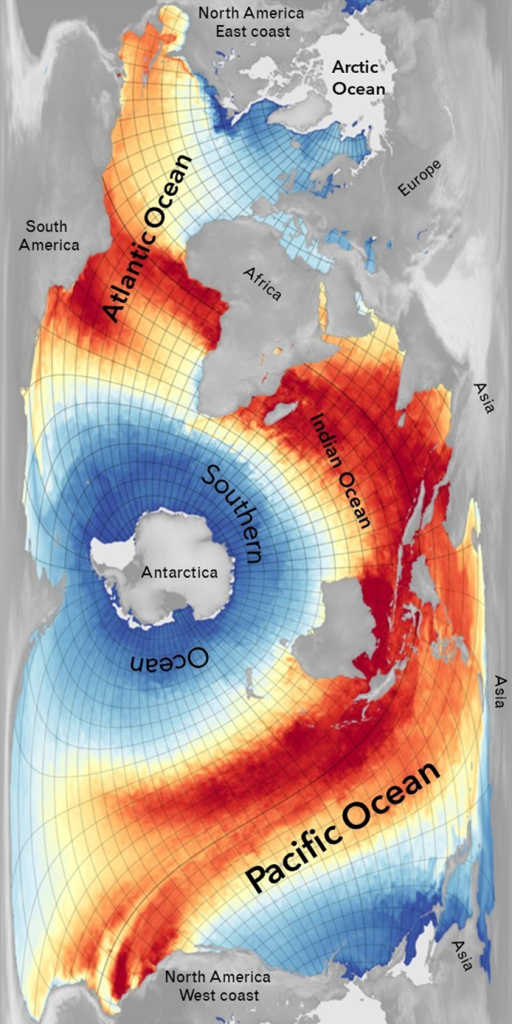
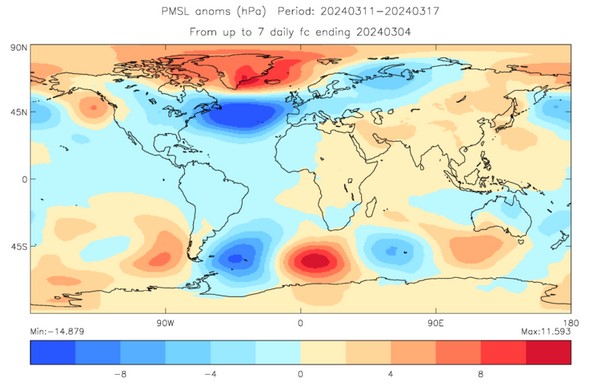
The very low extent from June-October was partly caused by enhanced warm northerly winds, associated with persistent areas of high and low pressure (Ionita, 2024). Early in the ice growth season, from May-July, these were concentrated near the Antarctic Peninsula, in the Weddell and Bellingshausen Sea regions; later in the growth season, from August-October, the strongest winds were to be found further west, in the Ross Sea. The position of the lowest sea ice conditions changed similarly.
However, it is likely that the ocean also played a part. The low extent of 2023 continues a pattern of very high variability in Antarctic sea ice since 2007, with first high and then low sea ice conditions persisting for long periods of time, in a way unlikely to be caused by known atmospheric changes (Hobbs et al., 2024). A key moment in this period of high variability was a large reduction that occurred in 2016, and this is thought to be linked to changes in the upper ocean caused by stronger westerly winds mixing warmer waters below towards the surface (Earys et al., 2021; Zhang et al., 2022). Further mixing of warm waters cannot be ruled out as an additional cause of the very low extent of 2023.
The precise contribution of anthropogenic (human-caused) global warming to the record low sea ice of 2023 is not yet known. While climate models predict that Antarctic sea ice extent will decrease in response to anthropogenic warming, variability in the past 15 years has been considerable, with very high extent from 2012-2014 followed by the current period of very low extent (Figure 2). Further extreme variability in either direction remains possible in the years ahead.

Figure 2. Antarctic sea ice monthly anomalies over the period of satellite observations. For each month, the 1981-2010 average ice extent for that month is subtracted. This largely removes the seasonal cycle so that subtler long-term changes can be viewed more easily.
During April we are exploring the topic of the ocean and climate. Follow the #GetClimateReady hashtag on X (formerly Twitter) to learn more throughout the month.
References
Eayrs, C., X. Li, M.N. Raphael and D.M. Holland (2021) Rapid decline in Antarctic sea ice in recent years hints at future change. Nat. Geosci., 14, 460–464. https://doi.org/10.1038/s41561-021-00768-3
Hobbs, W., and Coauthors (2024): Observational Evidence for a Regime Shift in Summer Antarctic Sea Ice. J. Climate, 37, 2263–2275, https://doi.org/10.1175/JCLI-D-23-0479.1
Ionita M (2024) Large-scale drivers of the exceptionally low winter Antarctic sea ice extent in 2023. Front. Earth Sci. 12:1333706, https://doi.org/10.3389/feart.2024.1333706
Zhang, L., T.L. Delworth, X. Yang, F. Zeng, F. Lu, Y. Morioka and M. Bushuk (2022) The relative role of the subsurface Southern Ocean in driving negative Antarctic Sea ice extent anomalies in 2016–2021. Commun. Earth Environ., 3, 302. https://doi.org/10.1038/s43247-022-00624-1

A map of Antarctica showing the Antarctic Peninsula separated by the Bellingshausen and Weddell Seas. Map: Adobe Stock.


You must be logged in to post a comment.